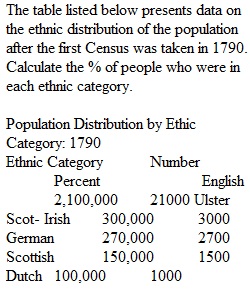
Q The table listed below presents data on the ethnic distribution of the population after the first Census was taken in 1790. Calculate the % of people who were in each ethnic category. Population Distribution by Ethic Category: 1790 Ethnic Category Number Percent English 2,100,000 Ulster Scot-Irish 300,000 German 270,000 Scottish 150,000 Dutch 100,000 Walsh 10,000 French 15,000 Jews 2,000 Swedish 2,000 Other 200,000 African 757,000 TOTAL 3,906,000 100.0% (Copy the table, paste it in your Word. Calculate the %s and write the in the table. Copy the table, paste it in Blackboard and submit it.)
View Related Questions